The AgriLink platform
AgriLink turns raw sensor data into clear answers — comparing under-panel vs open-field microclimate, mapping your stations, and alerting you the moment something changes.
One platform, full control
Everything you need to monitor and understand your agrivoltaic site.
Data analysis
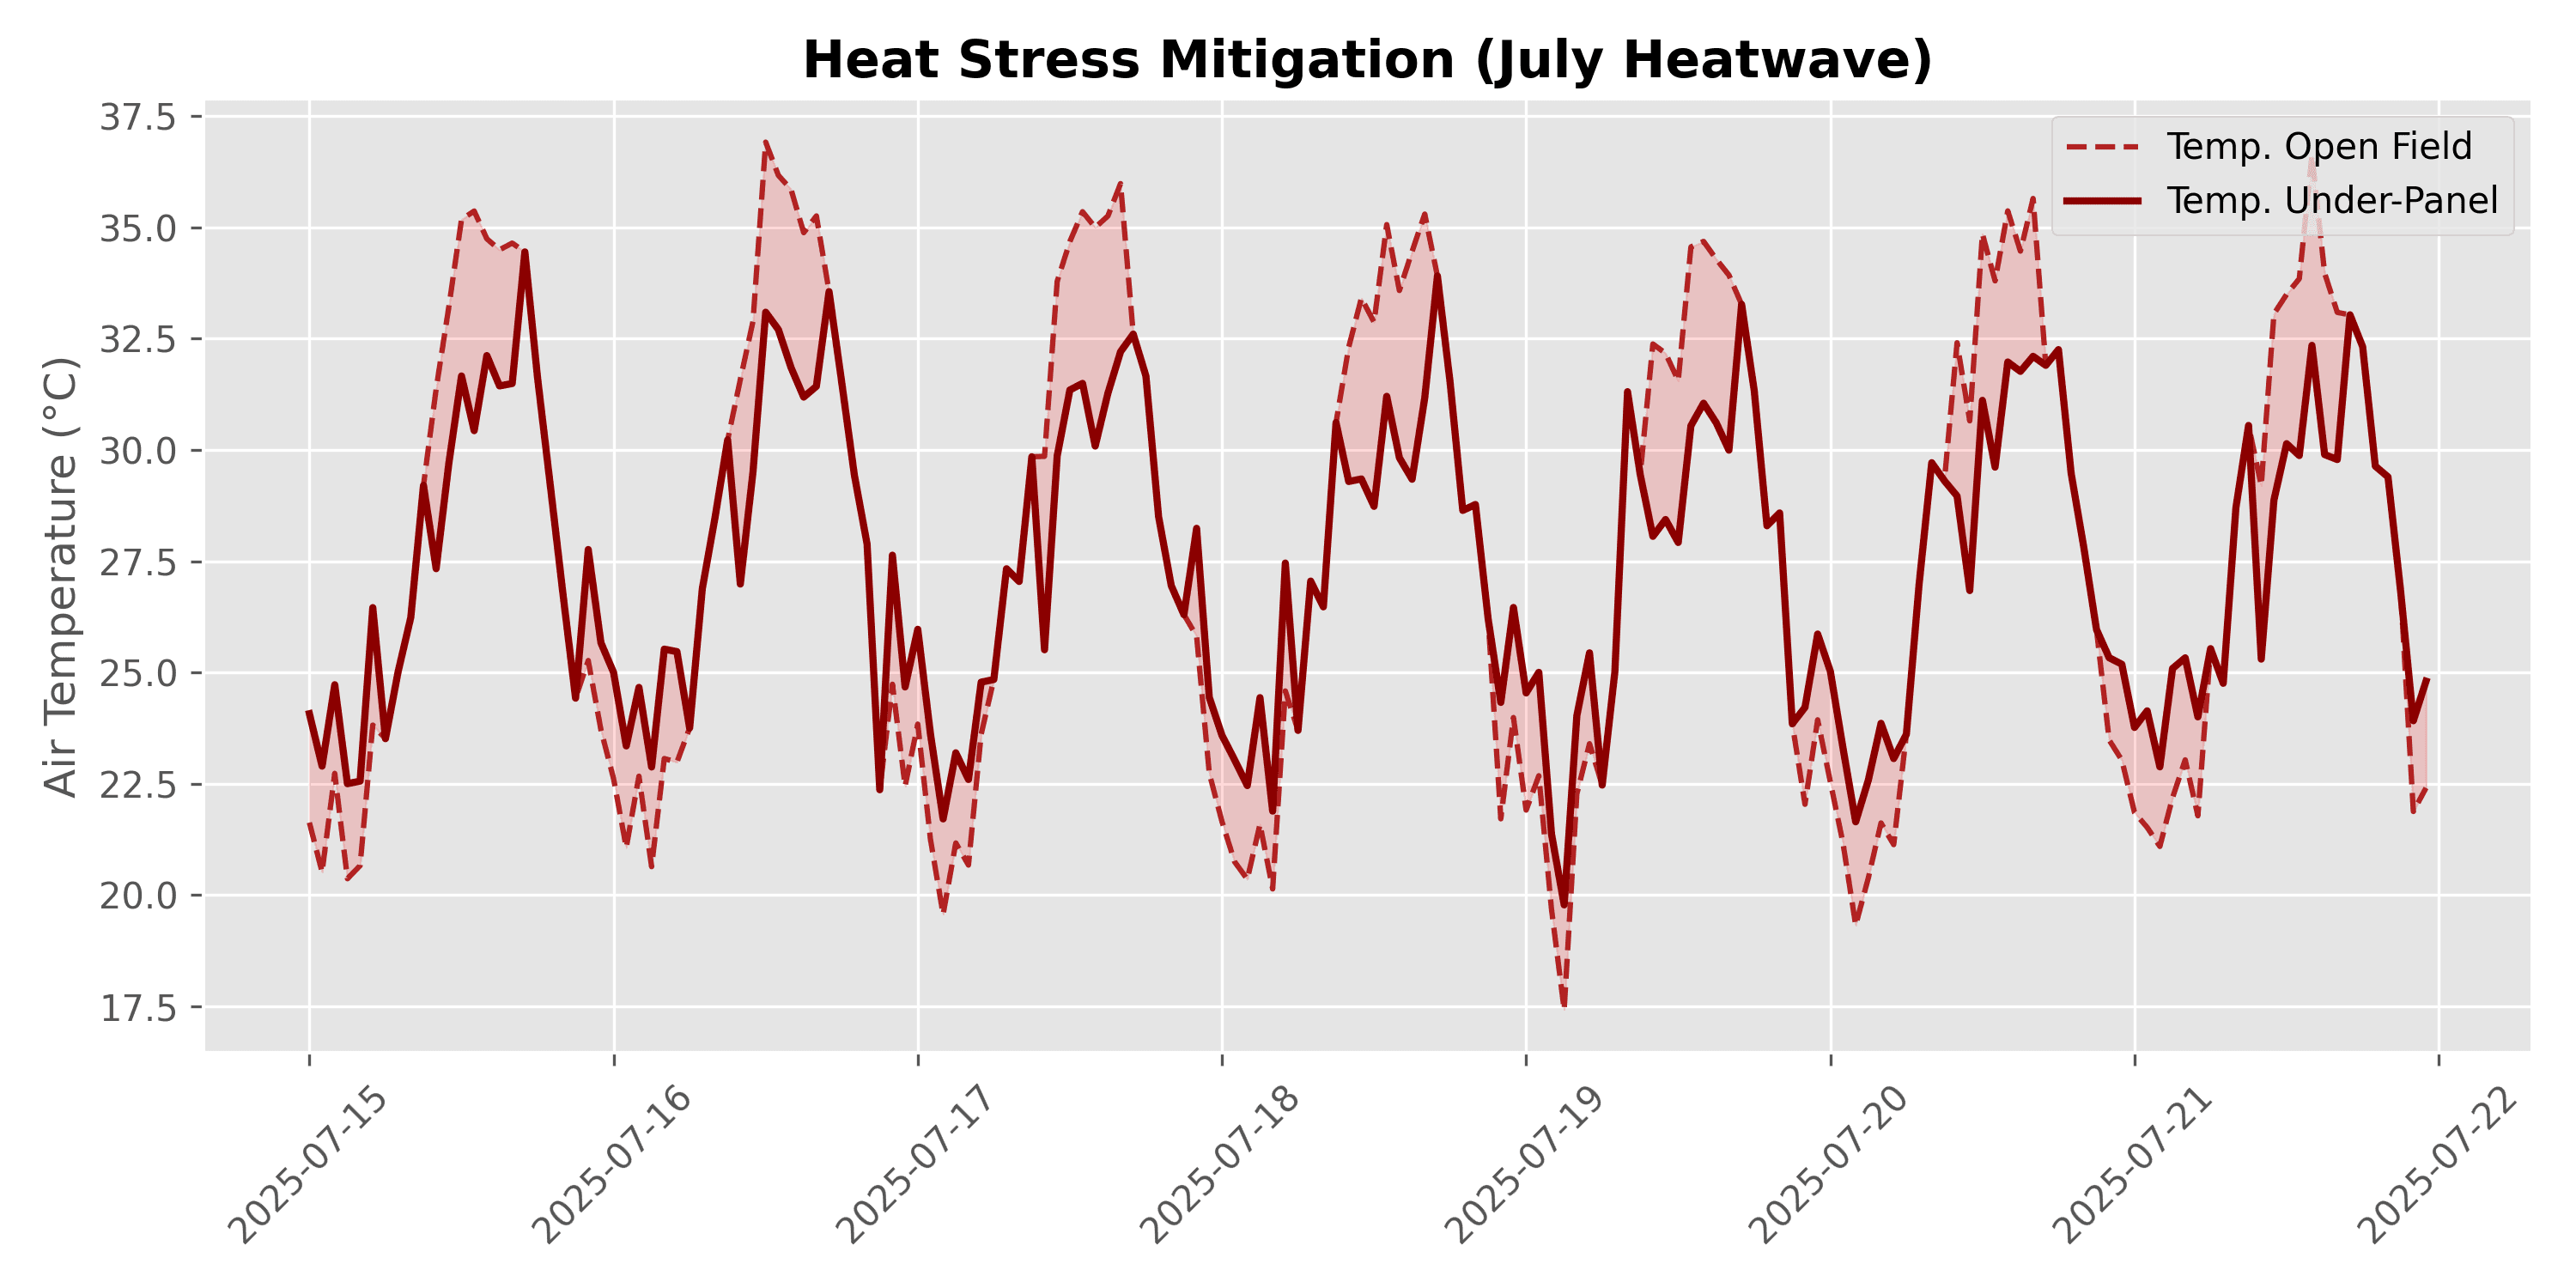
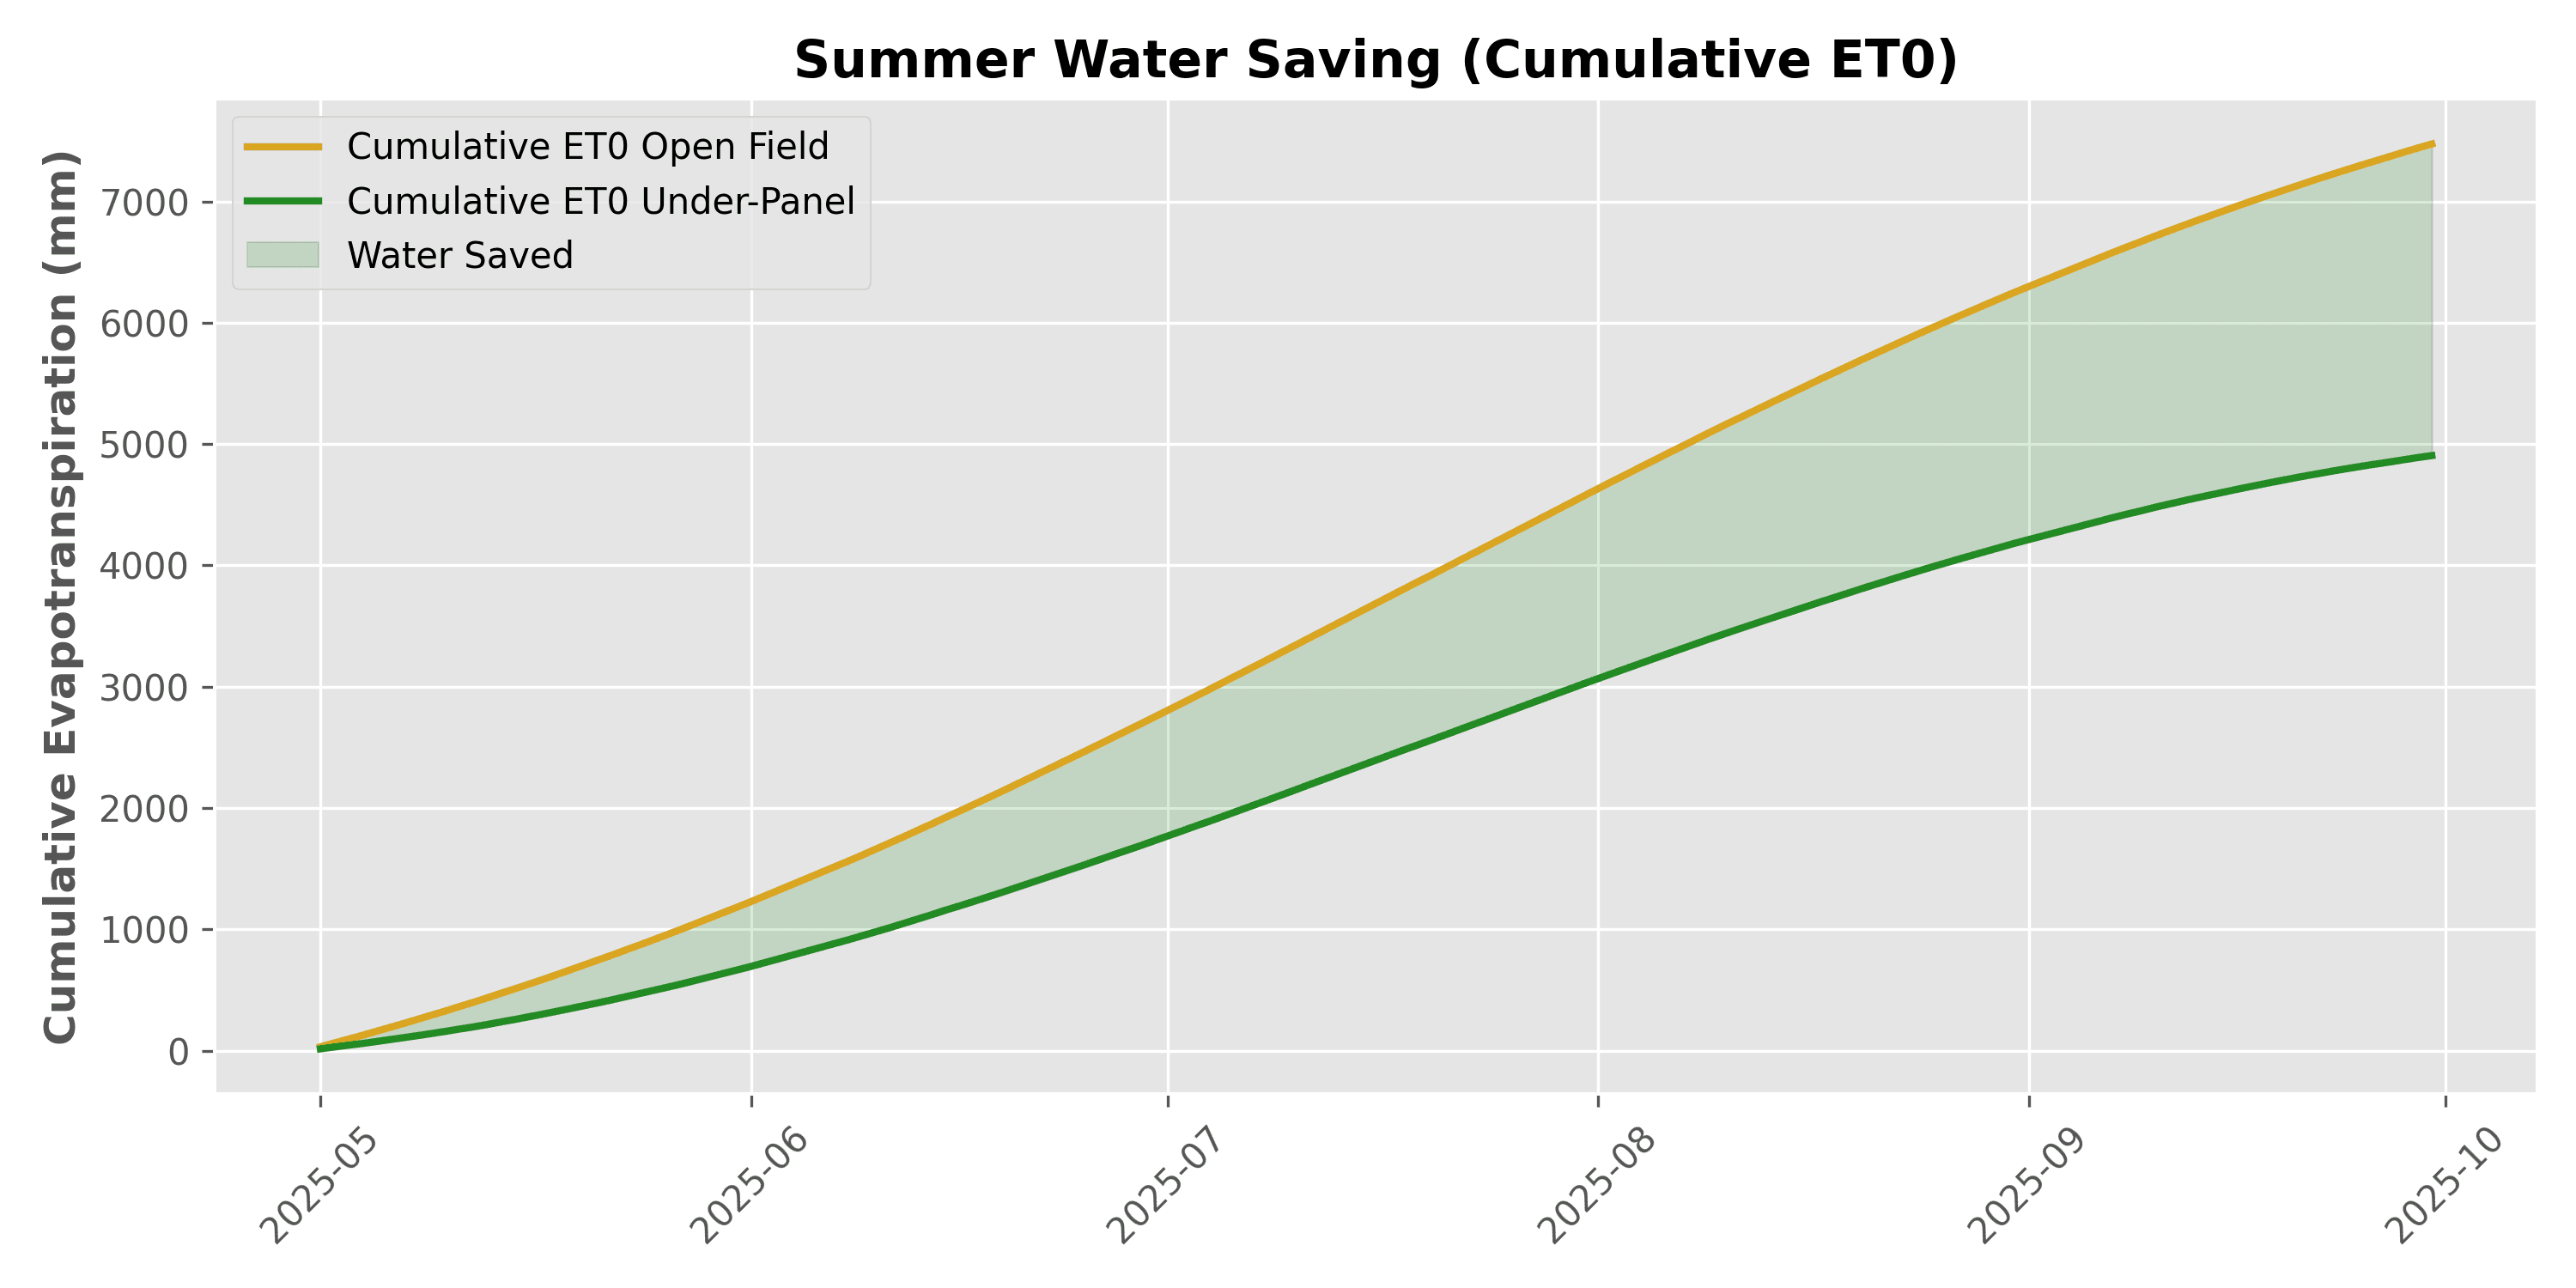
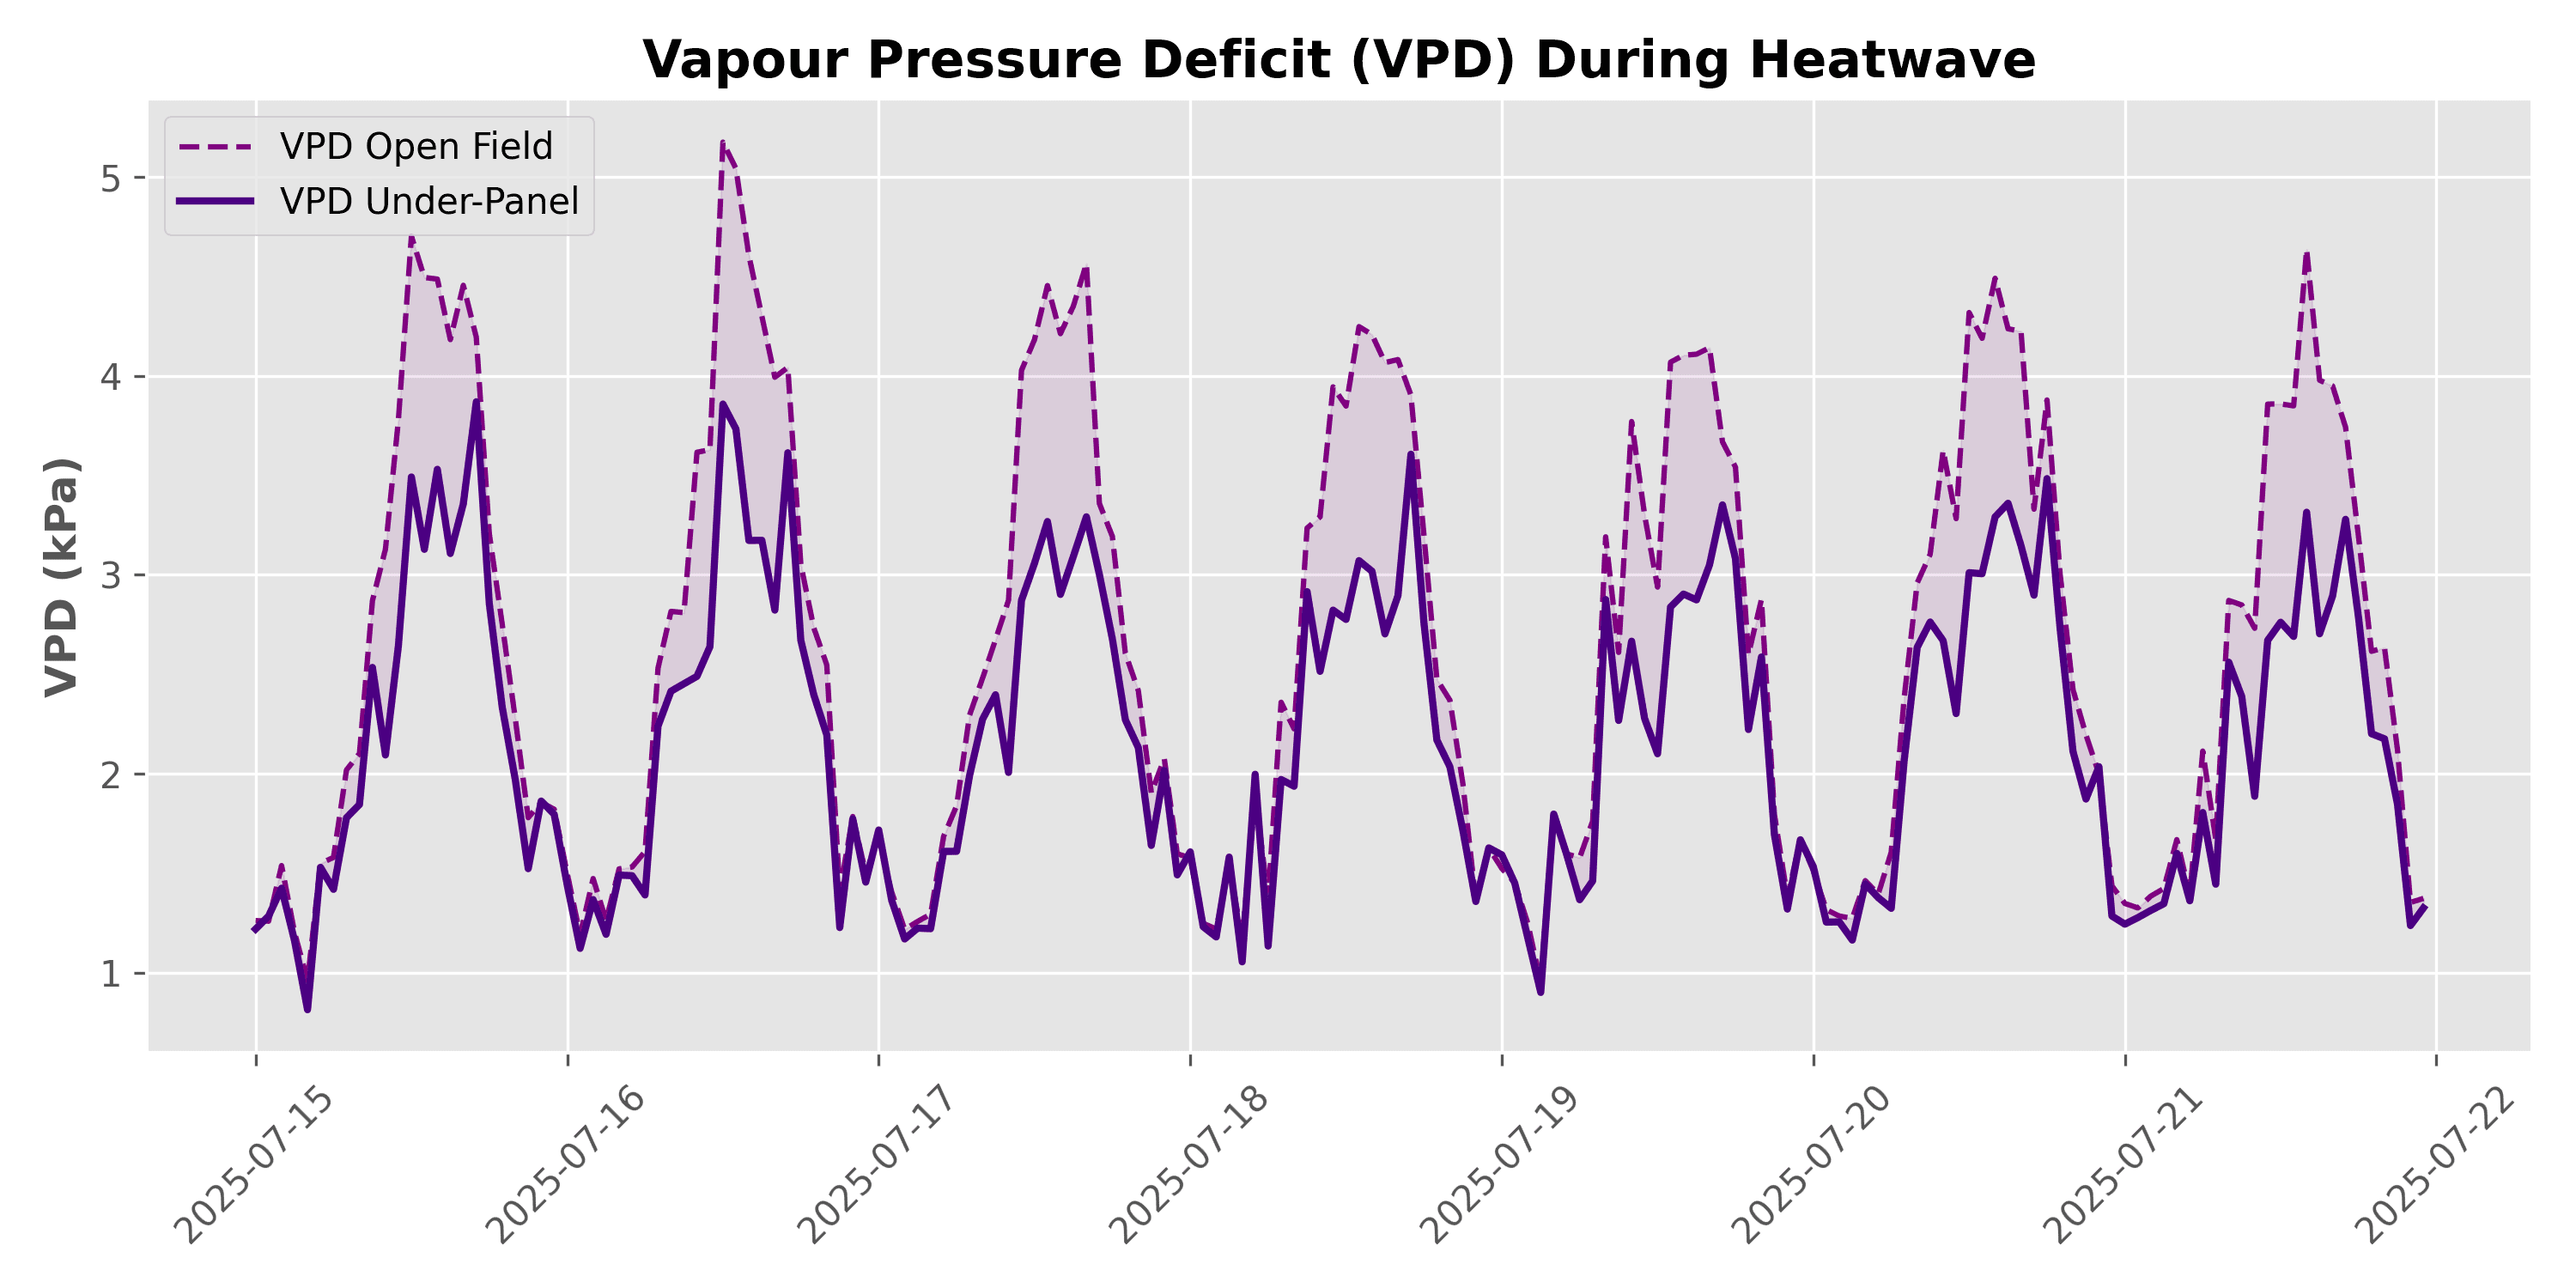
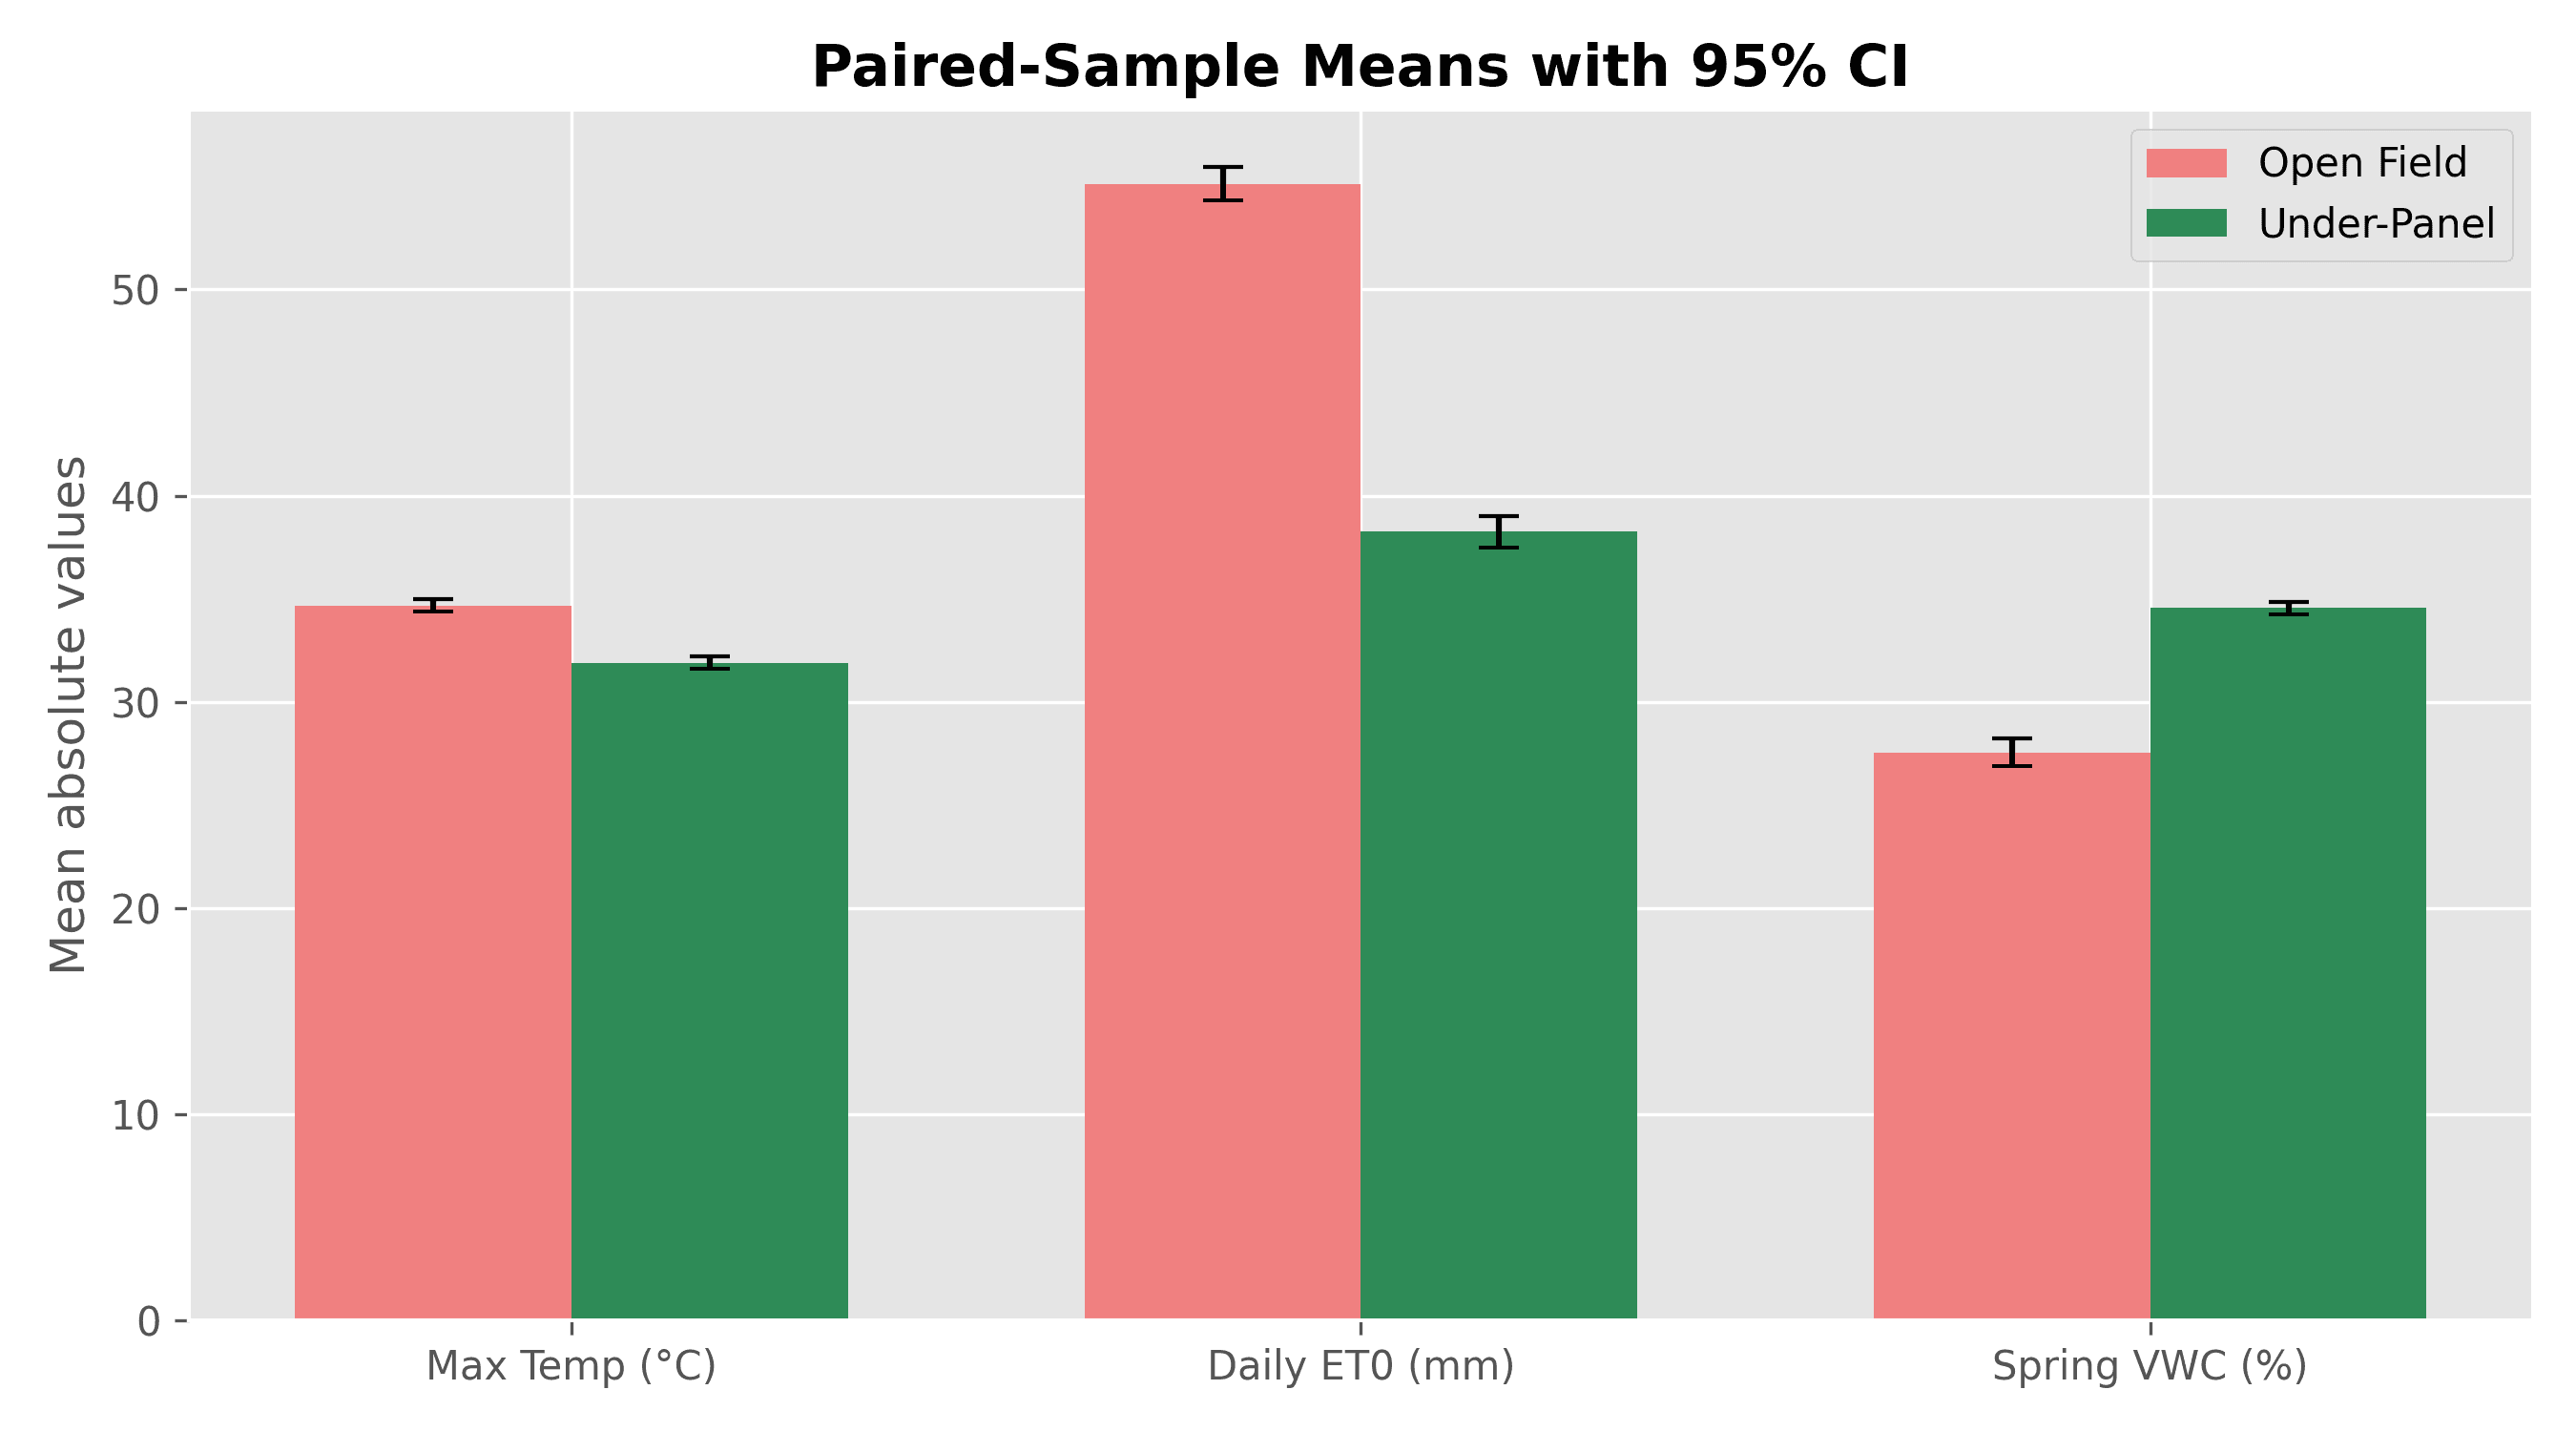
Compare open-field vs under-panel microclimate with interactive charts for temperature, radiation, soil, water and wind.
Stations map
See your whole fleet on a live map with status, heatmaps and per-station readings.
Smart alerts
Automatic SMS and email notifications the moment a sensor detects an anomaly.
Team & roles
Role-based access — admins configure stations, reviewers consult dashboards and download data.
AgriLink
Complete monitoring and autonomous management, from field to cloud.
AgriLink
RECEIVES - PROCESSES - MONITORS. Puts the data at your fingertips.
Reports for GSE
Compliant PDF generation.
Data analysis
Under-panel vs open-field comparison
Alerts
Anomaly notifications
Reports for GSE
Compliant PDF generation.
Data analysis
Under-panel vs open-field comparison
Alerts
Anomaly notifications
From data to a report, automatically
AgriLink turns a full year of measurements into the comparative charts and evidence your agronomist needs — ready to export.
Yours, in your language
AgriLink runs on our secure cloud or on your own server, and every user can choose their language: Italian, English, French or Spanish.